The Boston Consulting Group Matrix (BCG Matrix) Multicolor Template for PowerPoint-01
The Boston Consulting Group Matrix (BCG Matrix) Multicolor Template for PowerPoint-02
The Boston Consulting Group Matrix (BCG Matrix) Multicolor Template for PowerPoint-03
The Boston Consulting Group Matrix (BCG Matrix) Multicolor Template for PowerPoint-04
The Boston Consulting Group Matrix (BCG Matrix) Multicolor Template for PowerPoint-05
The Boston Consulting Group Matrix (BCG Matrix) Blue Template for PowerPoint-06
The Boston Consulting Group Matrix (BCG Matrix) Blue Template for PowerPoint-07
The Boston Consulting Group Matrix (BCG Matrix) Blue Template for PowerPoint-08
The Boston Consulting Group Matrix (BCG Matrix) Blue Template for PowerPoint-09
The Boston Consulting Group Matrix (BCG Matrix) Blue Template for PowerPoint-10
  • Load image into Gallery viewer, The Boston Consulting Group Matrix (BCG Matrix) Multicolor Template for PowerPoint-01
  • Load image into Gallery viewer, The Boston Consulting Group Matrix (BCG Matrix) Multicolor Template for PowerPoint-02
  • Load image into Gallery viewer, The Boston Consulting Group Matrix (BCG Matrix) Multicolor Template for PowerPoint-03
  • Load image into Gallery viewer, The Boston Consulting Group Matrix (BCG Matrix) Multicolor Template for PowerPoint-04
  • Load image into Gallery viewer, The Boston Consulting Group Matrix (BCG Matrix) Multicolor Template for PowerPoint-05
  • Load image into Gallery viewer, The Boston Consulting Group Matrix (BCG Matrix) Blue Template for PowerPoint-06
  • Load image into Gallery viewer, The Boston Consulting Group Matrix (BCG Matrix) Blue Template for PowerPoint-07
  • Load image into Gallery viewer, The Boston Consulting Group Matrix (BCG Matrix) Blue Template for PowerPoint-08
  • Load image into Gallery viewer, The Boston Consulting Group Matrix (BCG Matrix) Blue Template for PowerPoint-09
  • Load image into Gallery viewer, The Boston Consulting Group Matrix (BCG Matrix) Blue Template for PowerPoint-10

BCG Matrix Diagram for PowerPoint

Regular price
$5.00 USD
Sale price
$5.00 USD
Regular price
Sold out
Unit price
per 
Tax included.

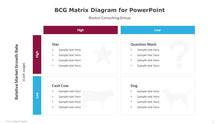
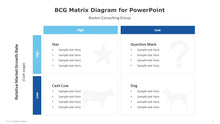
The Boston Consulting Group Matrix (BCG Matrix), is a business strategy tool used to analyze a firm's brand portfolio's strategic position. The BCG Matrix is one of the most widely used portfolio analysis techniques. The strategy divides a company's products and/or services into a two-by-two matrix. Depending on the relative market share and market growth rate, each quadrant is labeled as poor or high performance.

The matrix is made up of 2 axis and 4 quadrants. 

The horizontal axis of the BCG Matrix shows a product's market share. The vertical axis of the BCG Matrix indicates a product's growth rate.

The four quadrants in the BCG Matrix are:

  1. Question marks: Products with high market growth but low market share
  2. Stars: They are products having a high market share and a high rate of growth.
  3. Dogs: Products having a low market share and poor market growth.
  4. Cash cows: These are products that have a modest market growth but a large market share.

The BCG Matrix (Boston Consulting Group) Diagram for PowerPoint is perfect for leaders presenting to their team as well as consultants presenting their strategy to clients.

The BCG Matrix is made with native shapes, which allows you to freely modify and update the template. You may change the colors and graphics in the template to better represent your ideas.